Running a successful business isn’t limited to what product one sells or what services one renders. There are several factors that contribute to sustainability in business. One of the most prominent factor is having an effective sales management system. Accatex is a B2C SaaS sales management system that is designed to contribute immensely to business sustainability, by providing a smooth management operation that elevates business efficiency as well as user experience. Accatex achieves this by automating workflow, ensuring transparency and security in transactions, and also by providing real-time analytic insights that help in making smart decisions, all while ensuring that the platform is user-friendly and easy to navigate. All these ensure for a seamless management operation experience.
Sales management platforms are beneficial, however, users usually encounter some
challenges including:
1. Overly complex user interface. Users often find SaaS interfaces to be complicated,
and as such, their range of engagement on such platforms are limited.
2. Lack of real-time insight. This is a major challenge that users often encounter, as
its misinformation directly influences and affects their decision-making, thus putting
them at a disadvantage.
3. Business owners (users) often experience difficulty and end up making errors when
attempting to keep track of their inventories and invoices manually.

My Role:
User Experience Designer
Responsibilities:
Prototyping
User research
Visual Design
Wireframing
Tools used:
Figma
Duration:
4 weeks

The dashboard screen was designed to provide a general overview of all the business sales activity and analytic data. The dashboard serves to provide users with insights to major sales metrics, such as net revenue, conversion rate, a sales chart that displays the total amount sold per minute/day, and sales analytics. It is also optimized to let the users monitor their website visits and view its profile, as well provide them with real-time information about their ads. All this data will enable the user to make smart decisions effectively. The screen was designed to give the users clarity through its simple layout without compromising on its functionality.

Average Monthly Summary: This section displays a comprehensive summary of the business's net revenue, total website visits, total order, and profit target. This can be displayed annually, monthly, weekly or daily. This makes it easy and efficient for users to get key information conveniently.

Sales Conversion Rate: This section uses key performance indicator (KPI) which shares insights on the effectiveness of the sales process. It provides insights on data such as; number of products added to cart, and number of times the users reached the checkout. This insight or data helps the users figure out their level of efficiency, and the various improvements needed for the business to better serve their clients and increase sales.

Sales Activity: This section displays a list of relevant information specific to the clients’ orders. It displays both present and past orders, shows the order status, payment time and type, customers name and ID, as well as provides the users the option to carry out more actions like downloading a specific client order invoice or sorting and filtering orders based on different parameters such as date and status.

Ad's Analytics: This section uses KPI's to measure the effectiveness of the advertisements. It provides valuable data about the engagement metrics, which helps the business in making better decisions.
The order history is designed to provide valuable data for the operation of the business while making it convenient for the users to obtain this information. It contains several components that allow users to keep track of and manage their orders effectively. These include:

Average Monthly Summary: This section displays a comprehensive summary of the business's total orders, completed orders, and orders dispatched. This can be displayed annually, monthly, weekly or daily. This makes it easy and efficient for users to get key information conveniently.

Transaction/Order History: This folder displays the order list in terms of recent orders, completed orders, pending orders and cancelled orders. This helps in fostering transparency as well as increasing efficiency. It displays relevant information such as the order details, which show the quantity, type and price of each order, the payment method used by the clients, and the payment status. It also provides users the option to sort orders based on parameters such as date and status, and allows users to export or download any specific order detail for reference and record keeping.
Order Conversion Rate:This section acts as a key performance indicator (KPI) which shares insights on the effectiveness of the sales process. It provides data that helpsthe user know the specific actions taken by their clients when relating with their products. It consists of metrics such as; completed order, cancelled orders, lost orders, conversion rate percentage, and time frame. This information or data helps the users to figure out the various improvement needed for the business to better serve their clients and increase sales.

Top Purchasing Location:This scetion displays or showcases the geographical location of the user's customers by identifying the countries that play a significant role in contributing to sales. This data helps users recognize acknowledge the different locations that play a major role in supporting their business.
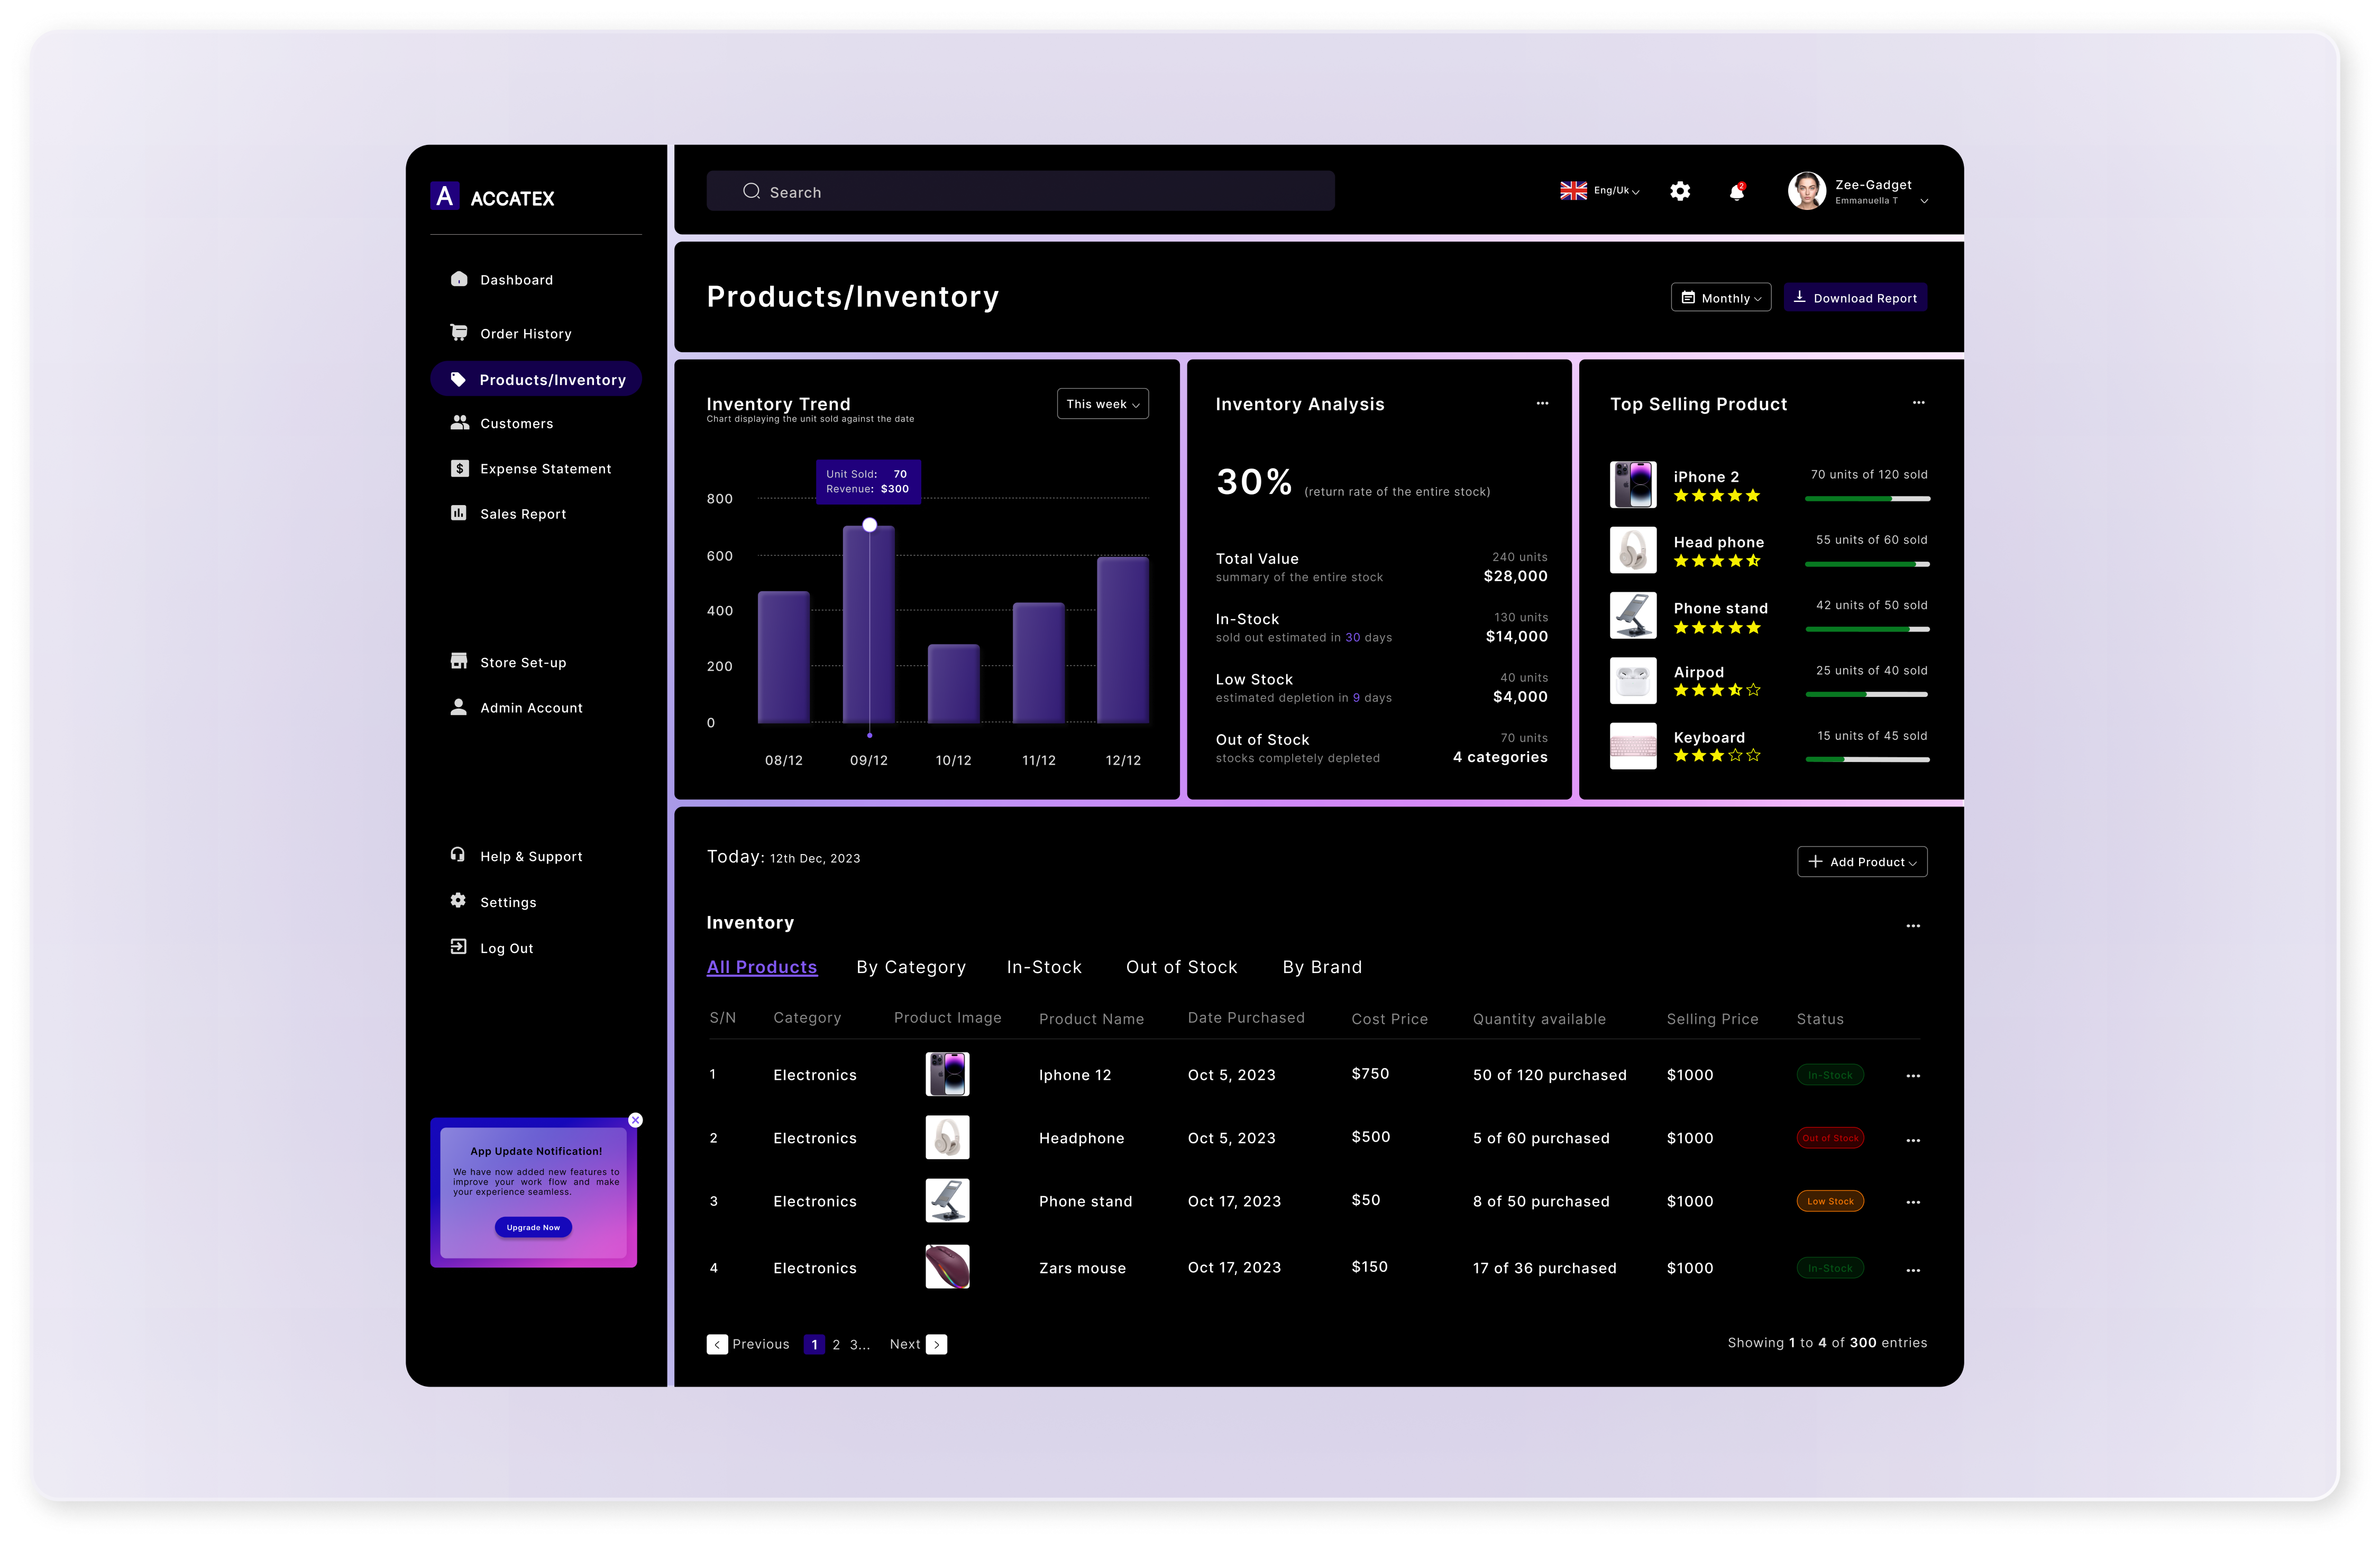
The product or inventory dashboard displays a well detailes list of all the inventory in stock, top-selling products, inventory trend, and analytics. This dashboard allows users to have a clear ......

Inventory List:This section displays a comprehensive list of all the business's products and also has filter options to display specific products. It also provides the option to add or input more products, delete, edit, and download. This allows users to efficiently manage and track their inventory.
Inventory Trend:This section displays the number of unit (product) sold within the time frame selected in a bar chart. It also shows the specific revenue and number of products sold on any of the bars selected.
Inventory Analytics: This section provides insights on stocks accuracy, products value, and sales prediction. This analytics enables businesses identify depleting supplies beforehand, thus allowing them to restock their inventory. This improves profitability and products availability.

Top Selling Product:Insights on the best-selling products, along with ratings, are displayed in this section. Real-time information such as the total amount of stock sold and the amount of stock remaining is also provided. This helps the users in making informed decisions in inventory management.
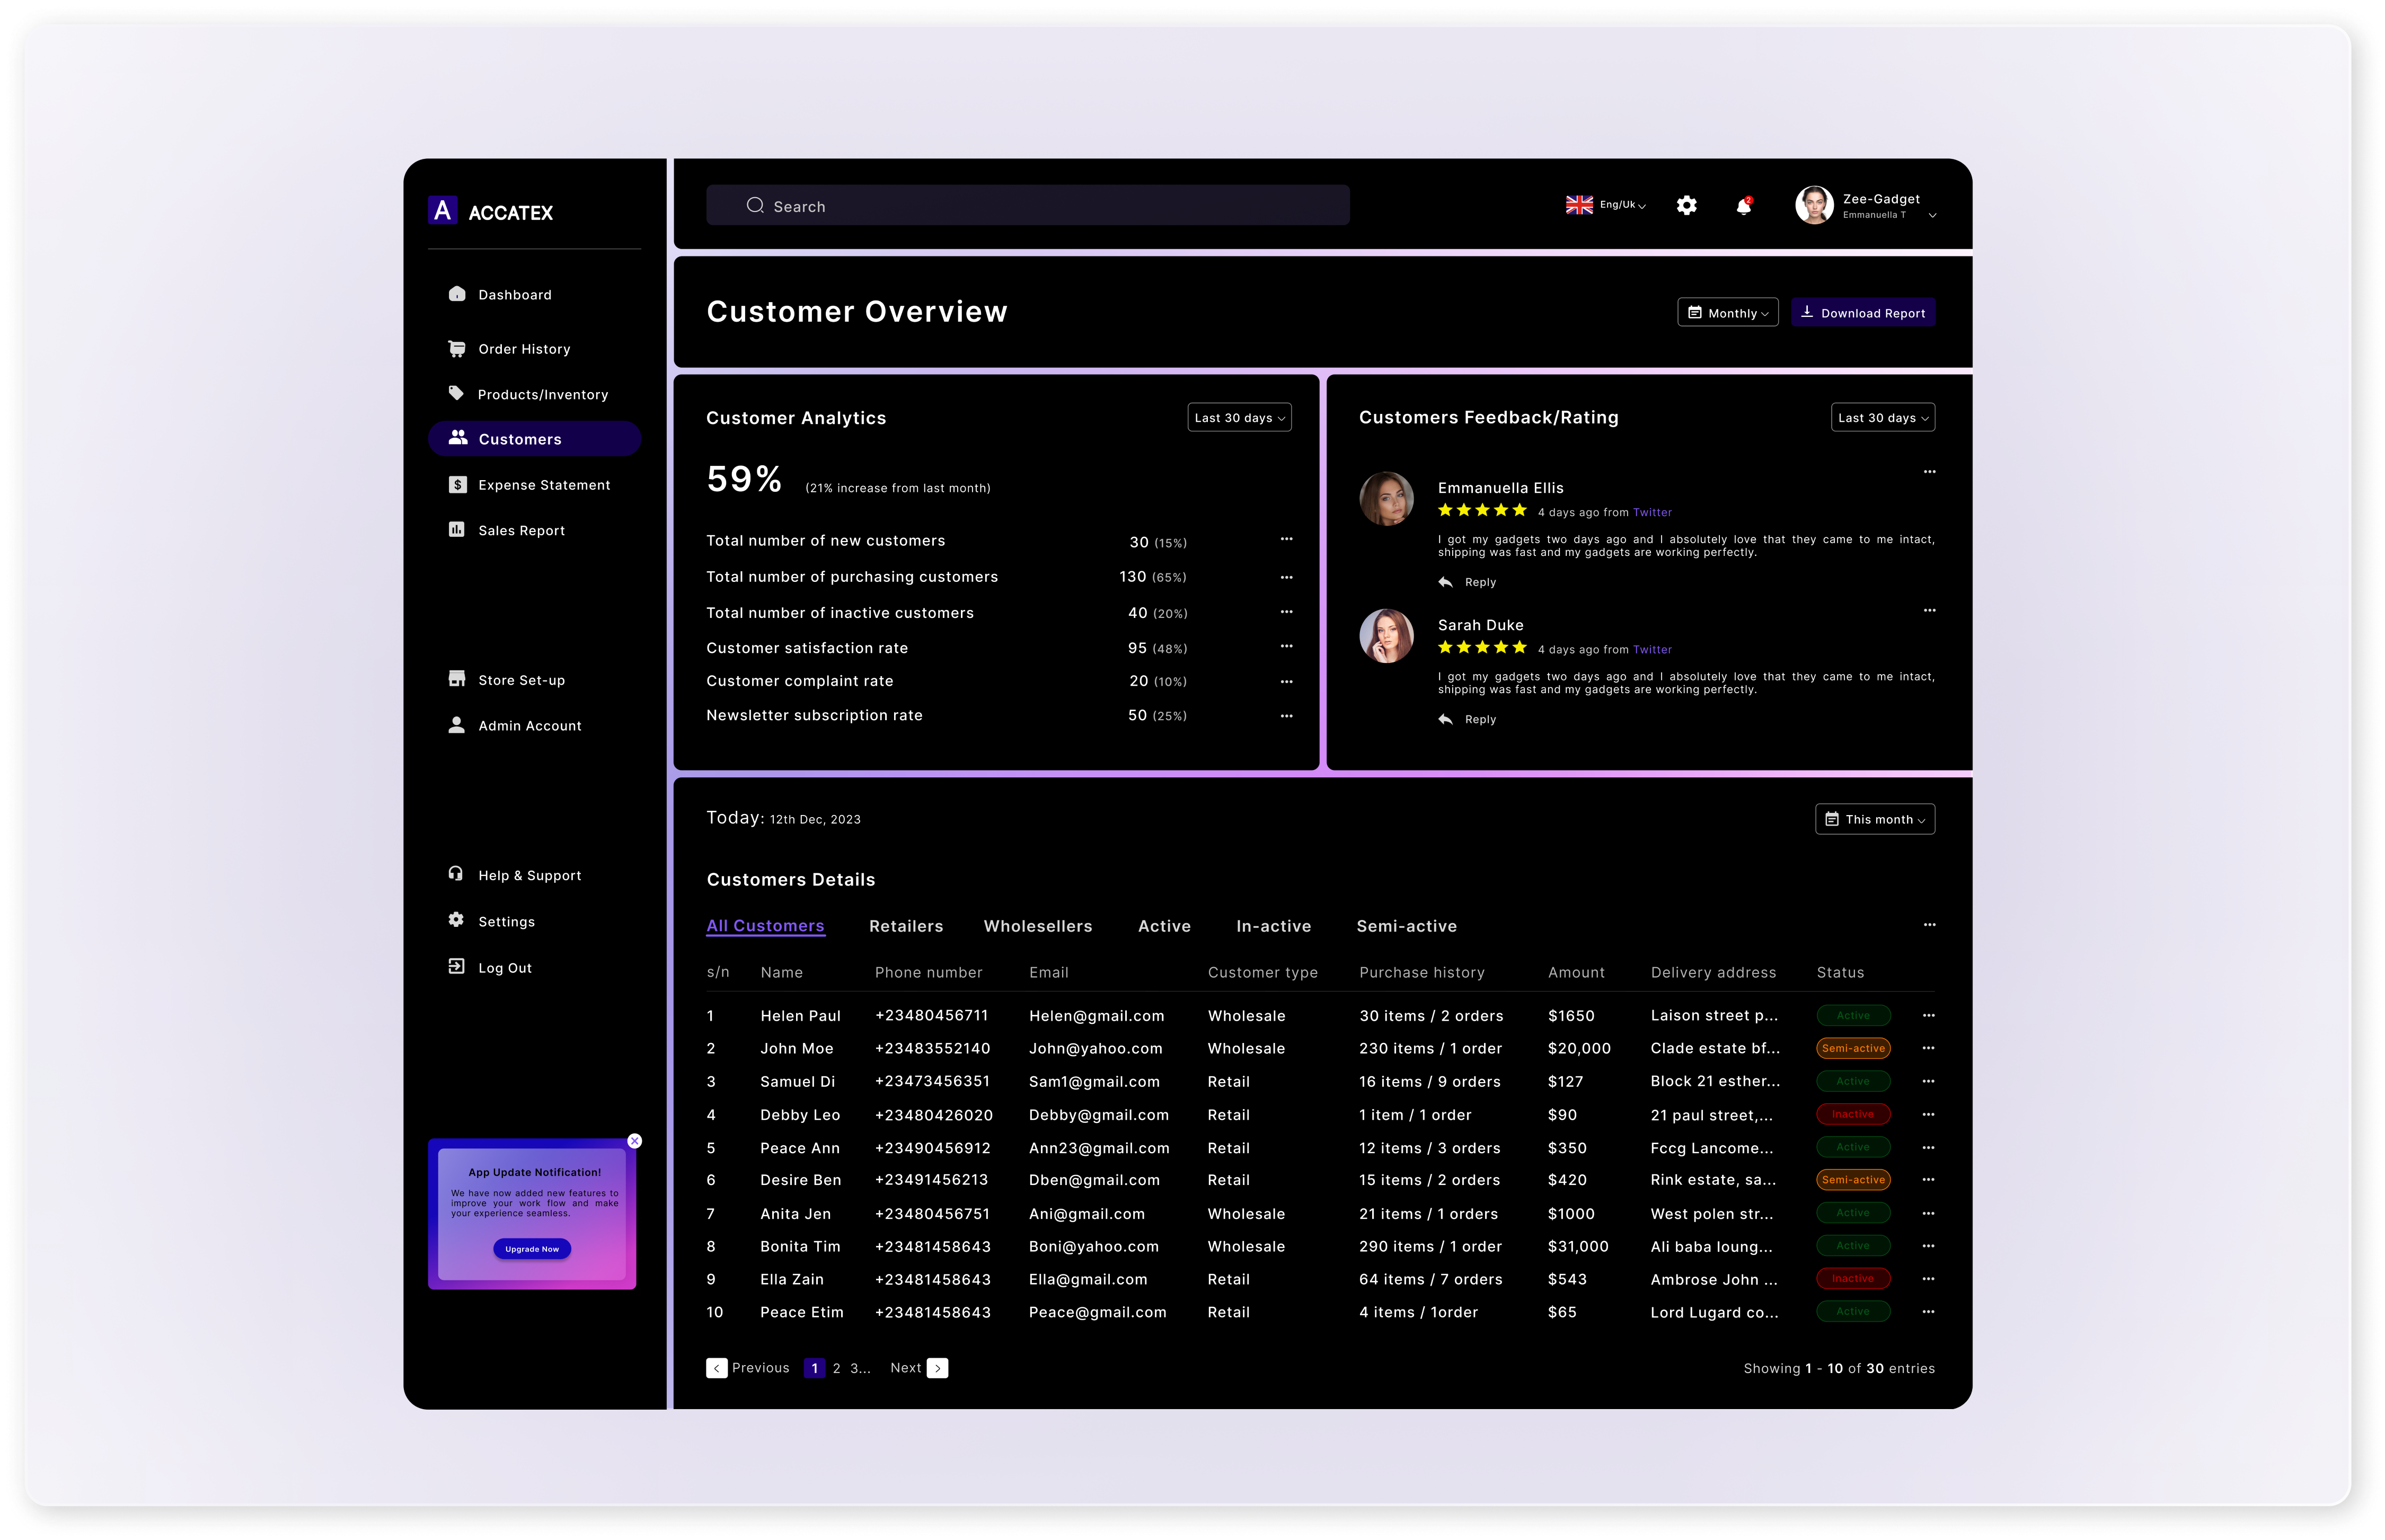
The customer overview dahsboard provides all relevant information needed to manage and monitor customer's engagement. It allows businesses to effectivley manage customer relationships and customer satisfaction.

Customer Detail: This section contains comprehensive information about each customer, including contact detail, purchasing history, and account status. This enables the businesses to efficiently manage customer communication and relations.

Purchase Analytics:This section provides customer-related data insights such as, customer complaint and feedback metrics, customers purchasing metrics, and newsletter subscription metrics. This enables businesses to have an understanding of and monitor their customers's lpoyalty status, purchasing frequency and subscription rates. It allows businesses to track their progress efficiently.

Customers Feedback:This section displays customer reviews, allows users to engage and address customers's complaints, and also identify areas of improvement. It helps users identify clients's pain points, and thus improve their experience by addressing those specific issues.
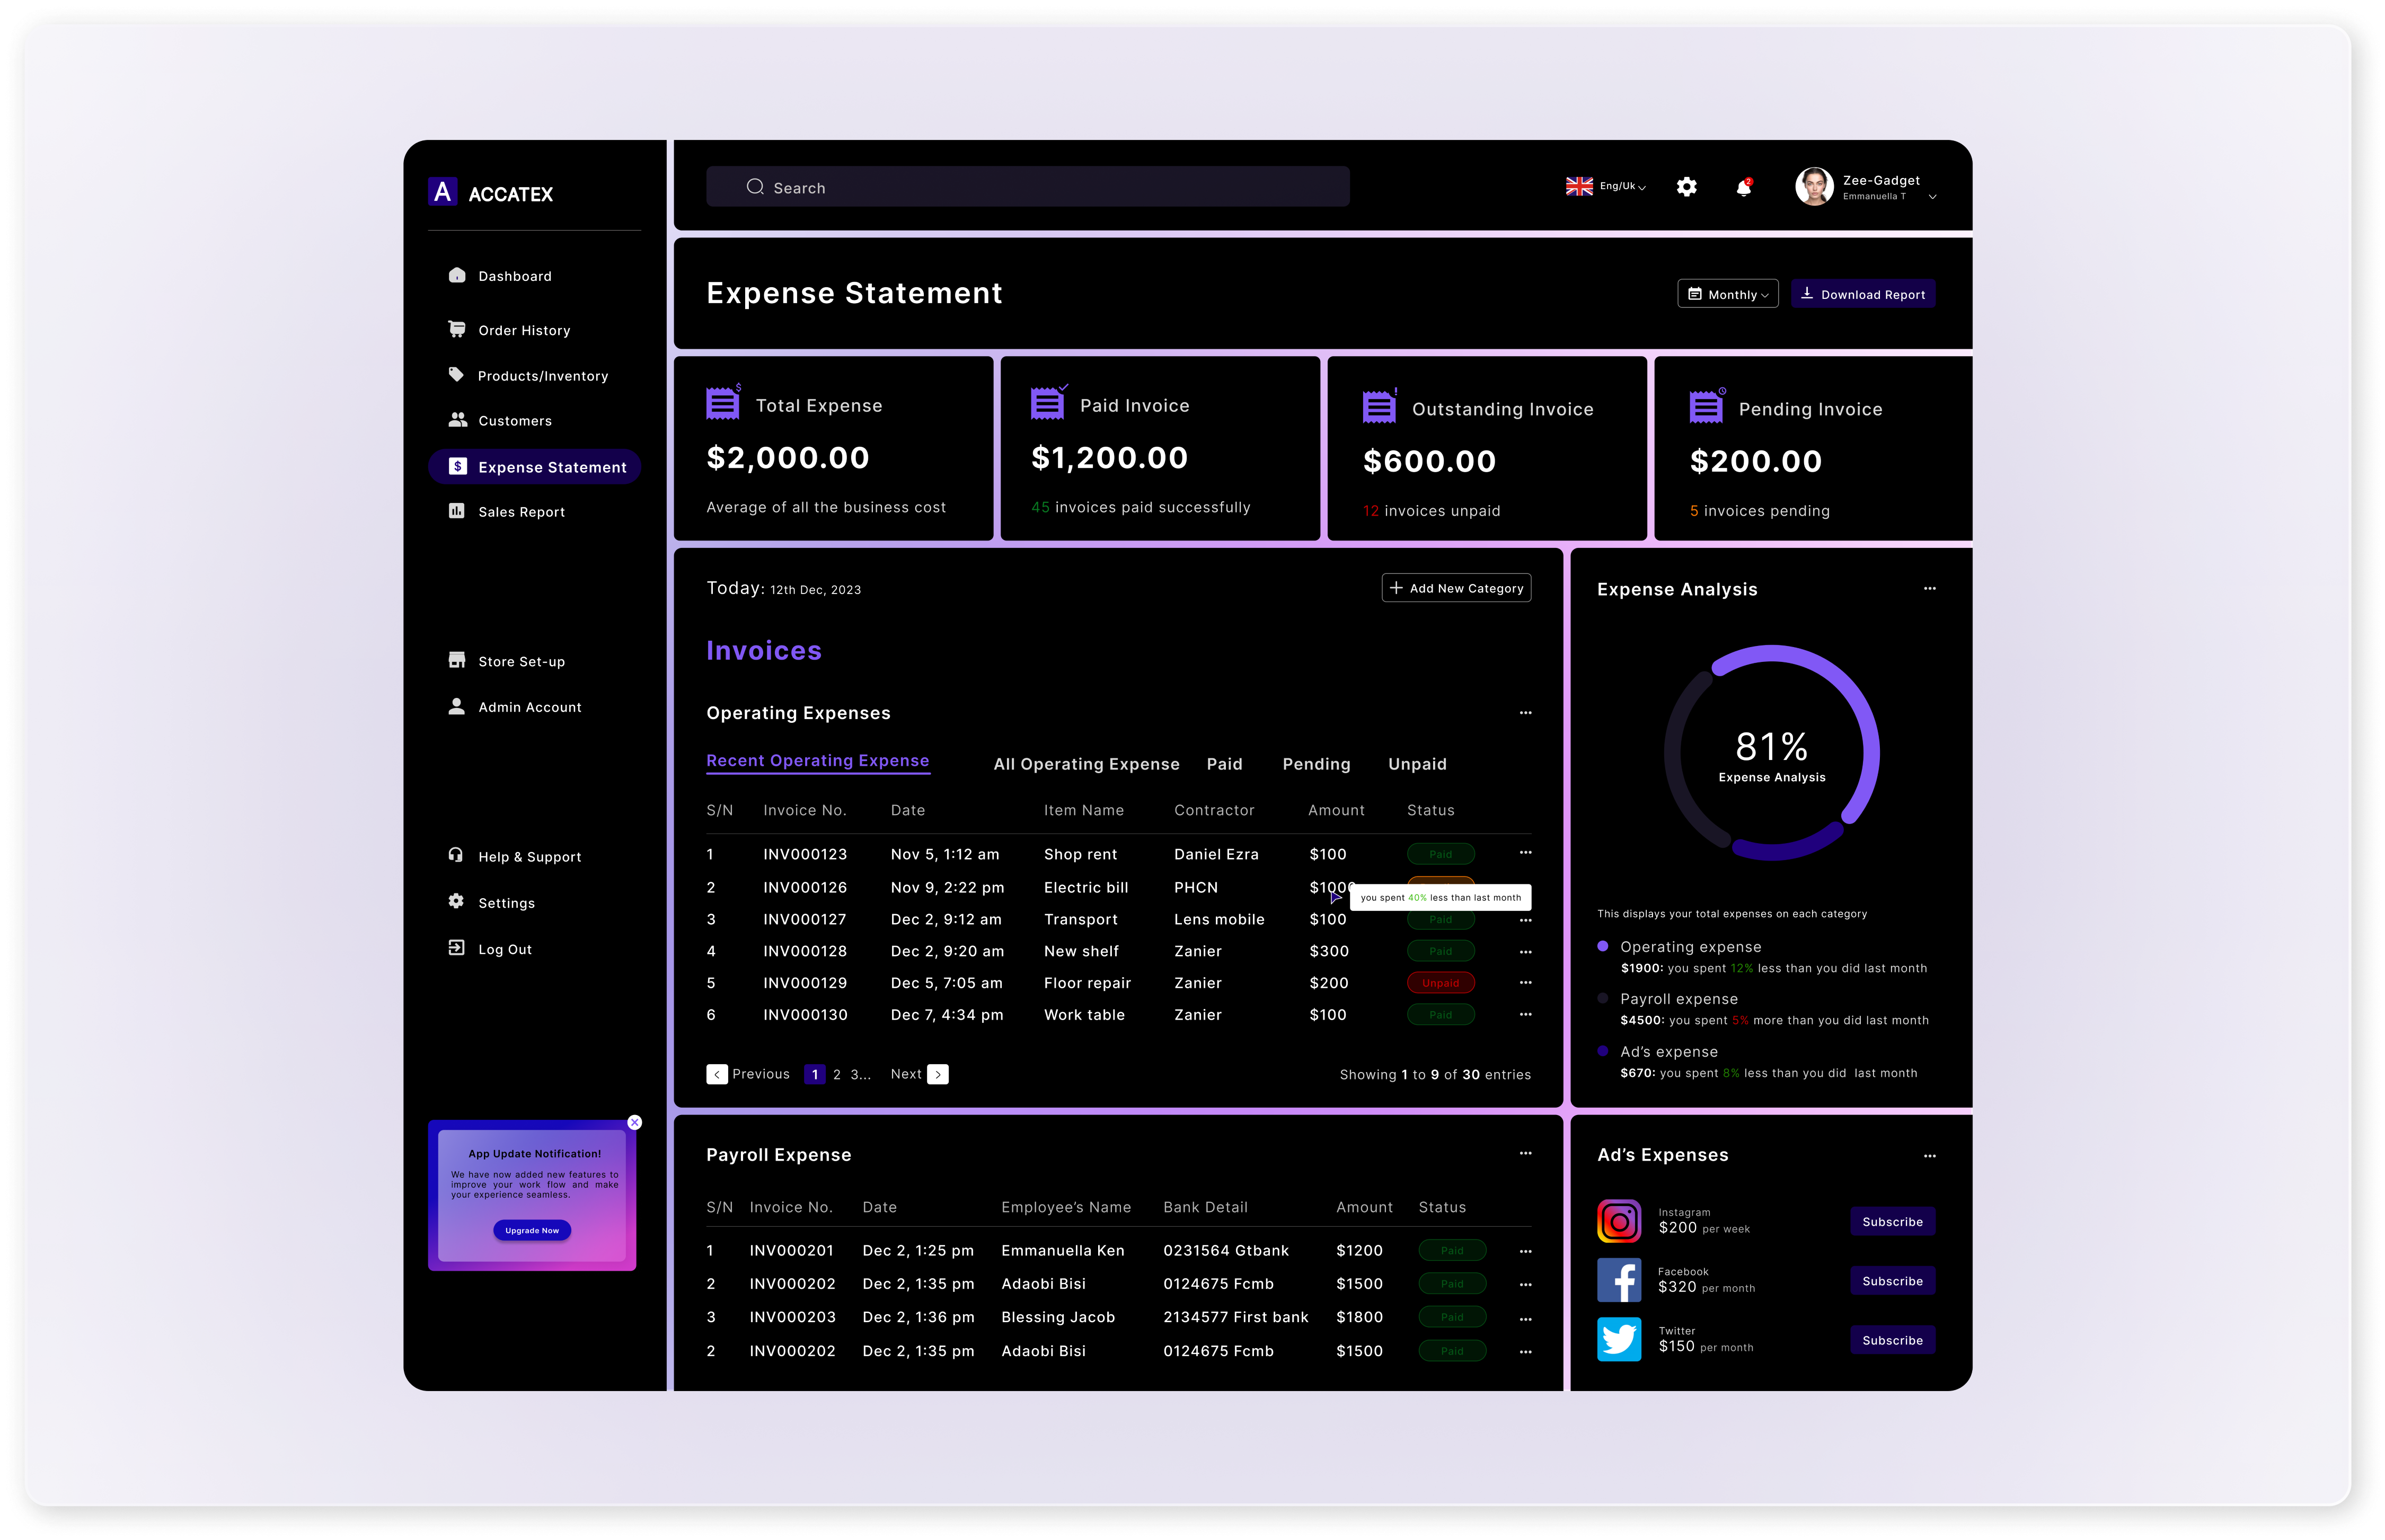
The expense statement dashboard provides a comprehensive overview of all the business's financial expenditures. It provides the business with analytic insights into the cost of running the business successfully and also helps the business to effectively monitor and make financially responsible decisions. it helps the business to effectively monitor and track expenses in different secions. Thes include:
Operating Expense:This section displays the total costs that the business incurs in running and maintaining its daily operations. This includes rents, electric bills and any other expense used to keep the business running. This section is also designed to track and compare each expense by the previous expense, thus helping the business to monitor and track its expenses.

Payroll Expense:This folder helps the business allocate and monitor salaries, commissions and bonuses, It helps in budgeting and managing the business's employess.

Expense Analytics:This section is designed to provide general analytic insights into the various expense sections of the business.
Ad's Expense: This section displays the various platforms the business uses in running and placing their ads, as well as the cost or subscription fee and the duration.